Bitcoin market cap is the total market value of all bitcoin that exist at the current price. It is the number that places Bitcoin first among all cryptocurrencies, and it is the first figure most people check when they want to know how big Bitcoin is. The price of one coin shows what a single BTC costs. The market cap shows what every coin in circulation is worth together. So, what is Bitcoin market cap, and why does every price tracker show it next to the price? This guide gives the definition, the formula and a worked example with numbers from 6 October 2026. It also covers supply, fully diluted valuation, dominance, history and the comparison with gold, and it lists what the number cannot tell you.
Key Takeaways
- Bitcoin market cap equals the price of one BTC multiplied by the circulating supply, which is about 20.09 million coins on 6 October 2026.
- At a price of $85,478 the total Bitcoin market cap is about $1.72 trillion.
- The fully diluted valuation, based on the 21 million maximum supply, is only about 4.5% higher, because 95.7% of all bitcoin already exist.
- Bitcoin dominance is about 57.5% of the $2.99 trillion total crypto market cap.
- The figure is not money invested and not the amount you would receive by selling, so it needs to be read together with liquidity and trading volume.
What Is Bitcoin Market Cap?
Bitcoin market cap is the value of all bitcoin currently in circulation, measured in US dollars. It works like the market capitalization of a listed company, where the share price is multiplied by the number of shares. For Bitcoin the share is replaced by one coin, and the number of shares is replaced by the number of coins that have been mined. The result is a snapshot of the size of Bitcoin at one moment, and it changes every time the price changes.
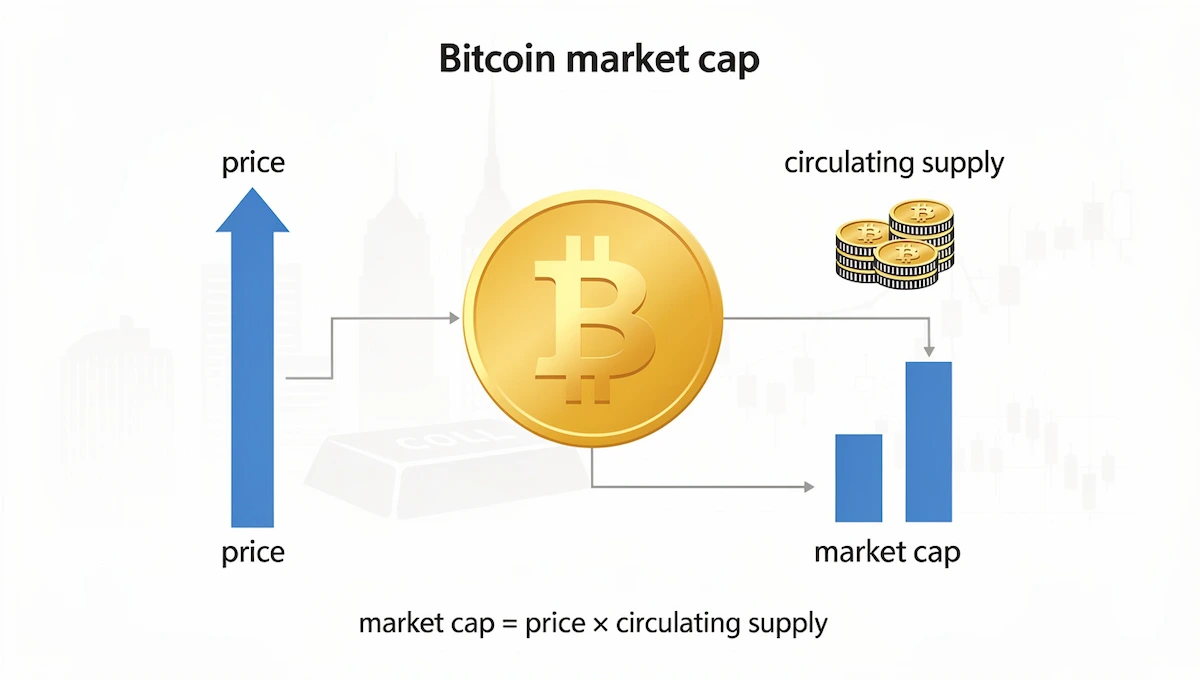
When people call Bitcoin the largest cryptocurrency, they mean it has the highest market cap. The coin launched in January 2009 with almost no value, and the total Bitcoin market cap is now about $1.72 trillion. Every price tracker ranks coins by this number, and the same number is used to compare Bitcoin with gold, with large companies and with the rest of the crypto market.
Bitcoin Market Cap Explained in Simple Terms
Think of a street with 100 houses. If the last house sold for $200,000, the whole street is valued at $20 million on paper, even though only one house changed owner. Bitcoin market cap follows the same logic. The latest trade sets the price, and that price is applied to every coin in circulation, including coins that have not moved for years.
This is why the market cap is useful for ranking and for comparing size, and why it should not be read as the sum of money that people have put into Bitcoin. The section about what the number does not show returns to this point.
Bitcoin Price vs Bitcoin Market Cap
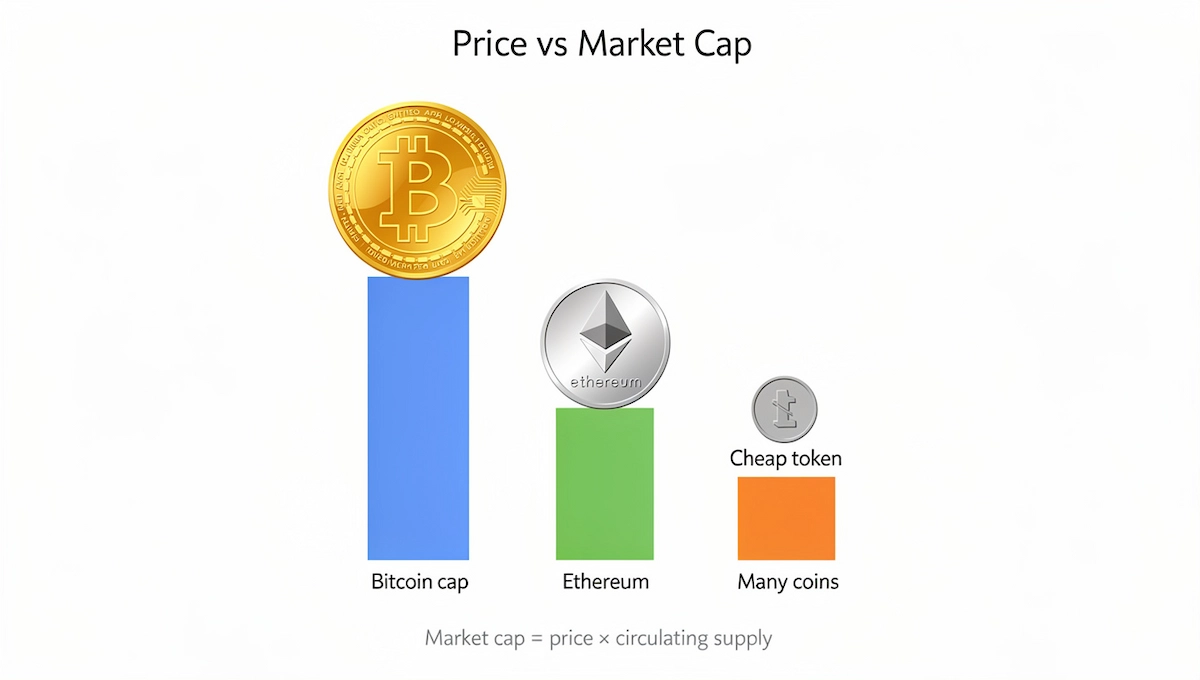
Price and market cap describe different things. The price is the cost of one BTC. The market cap is the value of all coins together. Take two assets as an example. Coin A costs $1 and has 1 billion coins in circulation, so its market cap is $1 billion. Coin B costs $100 and has 1 million coins in circulation, so its market cap is $100 million. Coin B has the higher price, but coin A is ten times bigger.
The same comparison works for any coin, and it is the reason the market cap in crypto is used to rank projects instead of the price. A price of $85,478 for Bitcoin and a price of $1.50 for XRP say nothing about which asset is larger until you multiply each price by its supply.
How Is Bitcoin Market Cap Calculated?
Bitcoin market cap is calculated by multiplying two numbers: the current price of one BTC and the circulating supply. Both numbers are public and update all day, so anyone can repeat the calculation in under a minute.

The BTC Market Cap Formula
BTC market cap = current price per BTC × circulating supply
This BTC market cap formula is the same one used for stocks, with coins instead of shares. The circulating supply is the number of bitcoin that have been mined and exist today. It is not the 21 million maximum supply, because that limit will only be reached around the year 2140. The Bitcoin market cap formula uses what exists now, so supply growth is slow and the price does most of the work.
How to Calculate Bitcoin Market Cap Step by Step
Here is how to calculate Bitcoin market cap with live numbers in four steps:
- Find the current price of one BTC in US dollars. On 6 October 2026, CoinMarketCap showed $85,478.
- Find the circulating supply. The same page showed 20,094,062 BTC.
- Multiply the two numbers: $85,478 × 20,094,062 = about $1.7176 trillion, which rounds to $1.72 trillion.
- Compare your result with the market cap shown on the data site. A small difference means the price changed between your two readings.
Reverse Formula: Which Price Gives a Target Market Cap
The BTC market cap formula also works backwards. Divide a target market cap by the circulating supply and you get the price that one BTC needs to reach it. With a supply of 20,094,062 BTC the numbers look like this:
| Target Bitcoin market cap | Price per BTC needed |
|---|---|
| $1.72 trillion (today) | $85,478 |
| $2 trillion | about $99,500 |
| $3 trillion | about $149,300 |
| $30 trillion (about the size of gold) | about $1.5 million |
A move of 1% in price changes the Bitcoin market cap by about $17.2 billion, which is a useful number for reading daily headlines.
Circulating Supply vs Total Supply vs Max Supply
Three supply numbers appear on every data site, and only one of them goes into the standard market cap.
| Supply type | Meaning | Bitcoin on 6 October 2026 |
|---|---|---|
| Circulating supply | Coins that have been mined and exist now | 20,094,062 BTC |
| Total supply | All coins created so far | about 20.09 million BTC |
| Max supply | The hard limit in the code | 21,000,000 BTC |
For Bitcoin the three numbers are close to each other, because no coins are locked in a vesting schedule or held back by a company. About 95.7% of all bitcoin are already mined. Many newer tokens have only 10% to 20% of their maximum supply in circulation, which is why their market cap and FDV can differ a lot, while for Bitcoin the gap is small.
Bitcoin Market Cap vs Fully Diluted Valuation (FDV)
Fully diluted valuation, shortened to FDV, uses the maximum supply instead of the circulating supply. The formula is FDV = current price × max supply. For Bitcoin that is $85,478 × 21,000,000 = about $1.795 trillion. The Bitcoin market cap is about $1.718 trillion, so the gap is roughly $77 billion, or 4.5%.
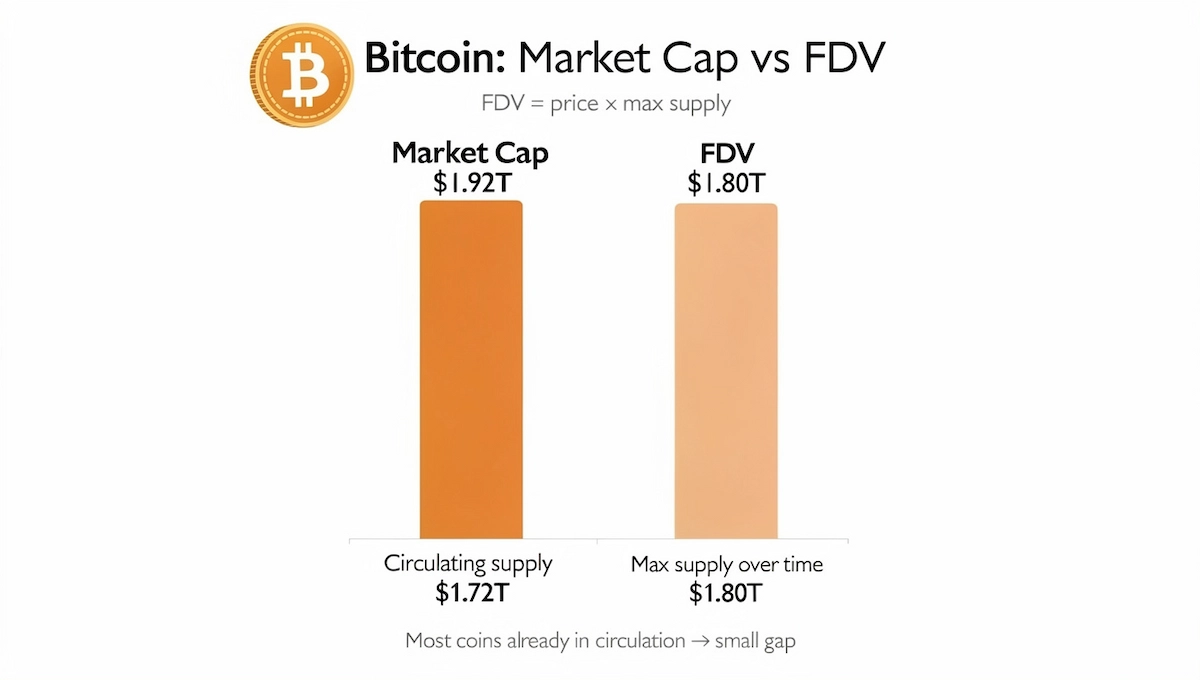
The gap is small because 95.7% of the coins already exist. For a token with 10% of its supply in circulation, the FDV would be ten times the market cap, and that gap would point to large future releases. Data sites also differ in how they show this figure. CoinMarketCap listed an FDV of $1.79 trillion for Bitcoin, while CoinGecko listed an FDV equal to the market cap, because it used the current supply. When you compare FDV numbers, check which supply the site used.
For Bitcoin the FDV is mostly theoretical. The last coin will be mined around 2140, and some coins are lost, so the full 21 million will never be active in the market. The market cap based on circulating supply stays the standard figure.
Why Bitcoin Market Cap Changes Every Day
Bitcoin market cap changes every second because both parts of the formula can change. Price moves much faster than supply, so price explains almost every daily move in the market cap.
Price Moves First
When the price rises by 10% in a day, the market cap rises by about 10% too, since the supply barely changes in that time. News about spot ETF flows, interest rates, inflation data and regulation are the usual reasons for large price moves. On 5 October 2026 the price turned back near $87,000 and the market cap stayed around $1.71 trillion.
Supply, Mining Rewards and Halvings
New coins enter circulation through Bitcoin mining. Miners add a block about every 10 minutes and receive a block reward, which is 3.125 BTC since April 2024. That is about 144 blocks and 450 new BTC per day, worth around $38 million at the current price. Compared with a supply of 20.09 million, the daily issuance is about 0.002%, so supply adds to the market cap very slowly.
The reward is the only way new bitcoin are created, and it is the reason the circulating supply grows on a fixed and known schedule instead of a schedule decided by a company or a central bank. Anyone can check the number of coins on a block explorer and compare it with the figure used by a data site.
The reward is cut in half every 210,000 blocks, which takes about four years. This event is called the Bitcoin halving. The next halving is expected in 2028 and will reduce the reward to 1.5625 BTC. Each halving lowers the rate at which supply grows, and the circulating supply moves closer to 21 million without reaching it for more than a century.
Current Bitcoin Market Cap and Where to Check It
The current Bitcoin market cap is shown on every major data site and updates in real time. These are the numbers from CoinMarketCap on 6 October 2026:
| Metric | Value |
|---|---|
| Price of one BTC | $85,478 |
| Circulating supply | 20,094,062 BTC |
| Max supply | 21,000,000 BTC |
| Bitcoin market cap | about $1.72 trillion |
| FDV | about $1.79 trillion |
| 24 hour trading volume | $28.83 billion |
| Share of max supply in circulation | 95.7% |
These figures change with every trade, so treat them as a snapshot taken on one day. To see the Bitcoin market cap today, open one of the two sources most people use, CoinMarketCap or CoinGecko. Both show price, supply, market cap and volume on one page.
Why CoinMarketCap and CoinGecko Show Different Numbers
On the same day CoinMarketCap showed a market cap of about $1.7176 trillion and CoinGecko showed $1.726 trillion. The gap is about $8.4 billion, or 0.5%. Both sites counted a circulating supply of about 20.094 million BTC, so most of the difference came from the price: $85,478 on CoinMarketCap and $85,889 on CoinGecko at the time of the reading. Sites take prices from different exchanges, weight them in different ways and refresh at different intervals.
For Bitcoin the differences stay small. For tokens with locked or reserved coins the sites can disagree about the supply itself, and the gap can be large. If you compare numbers over time, use the same site each time and note the time of the reading.
Bitcoin Market Cap vs Total Crypto Market Cap
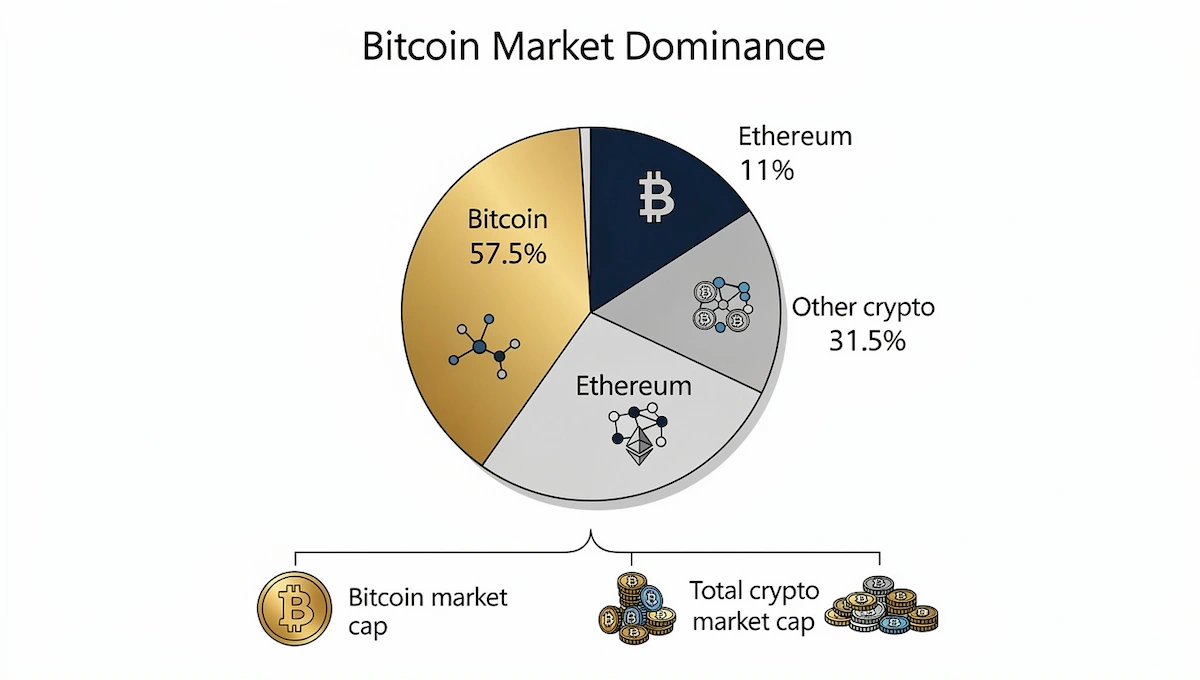
The total crypto market cap is the sum of the market caps of all tracked coins and tokens. CoinGecko listed $2.988 trillion on 6 October 2026 for more than 21,800 coins. Bitcoin market cap makes up a little more than half of that amount, with Ethereum at 11% and thousands of other assets sharing the rest. Comparing the two numbers shows whether Bitcoin is gaining or losing ground against altcoins.
Bitcoin Dominance Formula
Bitcoin dominance = Bitcoin market cap ÷ total crypto market cap × 100
With $1.7176 trillion for Bitcoin and $2.988 trillion for the whole market, the result is 57.5%. CoinGecko reported between 57.5% and 57.7% during the day. Bitcoin dominance rises when money moves into Bitcoin or when altcoins fall faster, and it falls when altcoins grow faster than Bitcoin. Traders use it as a rough sign of risk appetite, but the dominance number alone does not predict the price.
Bitcoin Market Cap History
The growth of Bitcoin market cap from zero to more than a trillion dollars took about twelve years. This section lists the main milestones in one table and then explains each stage.
| Date | Milestone | Detail |
|---|---|---|
| January 2009 | Launch | Bitcoin starts with no market value |
| 2013 | First billion | Market cap passes $1 billion |
| October 2017 | $100 billion | About nine years after launch |
| February 2021 | First $1 trillion | Price had passed $50,000 on 17 February |
| 10 November 2021 | Record of that cycle | Price of $68,789.63, market cap around $1.3 trillion |
| 6 October 2025 | Price record | Price of $126,198, market cap around $2.5 trillion |
| 6 October 2026 | Today | Price of $85,478, market cap about $1.72 trillion |
From Zero to the First $100 Billion
In January 2009 Bitcoin had no market value, and in the first years it was used mostly by developers and people interested in cryptography. The market cap passed $1 billion in 2013 and reached $100 billion in October 2017, about nine years after launch. In December 2017 the price came close to $20,000, and the year ended with a sharp correction. The full story of the coin is covered in the history of Bitcoin.
The $1 Trillion Milestone
The first trillion came in February 2021. Tesla announced a purchase of $1.5 billion in bitcoin on 8 February, Mastercard said it would support digital assets, and the price rose from about $39,000 to $47,000 within a day and passed $50,000 on 17 February. The total Bitcoin market cap went above $1 trillion shortly after. In 2021 the price set new records in April and in November, and the market cap of that cycle peaked around $1.3 trillion on 10 November 2021.
All-Time High Market Cap
The price record of Bitcoin is $126,198, reached on 6 October 2025 according to CoinMarketCap. Multiplying that price by the circulating supply at the time, about 19.9 million BTC, gives an all-time high market cap of roughly $2.5 trillion. At $85,478 the price is 32.2% below that record, and the market cap is about $800 billion lower.
Bitcoin Market Cap vs Gold and Other Large Assets
The most common comparison for Bitcoin market cap is gold, because both are described as stores of value with limited supply. The market cap of gold is estimated by multiplying the above-ground gold, about 216,265 tonnes according to the World Gold Council, by the spot price.
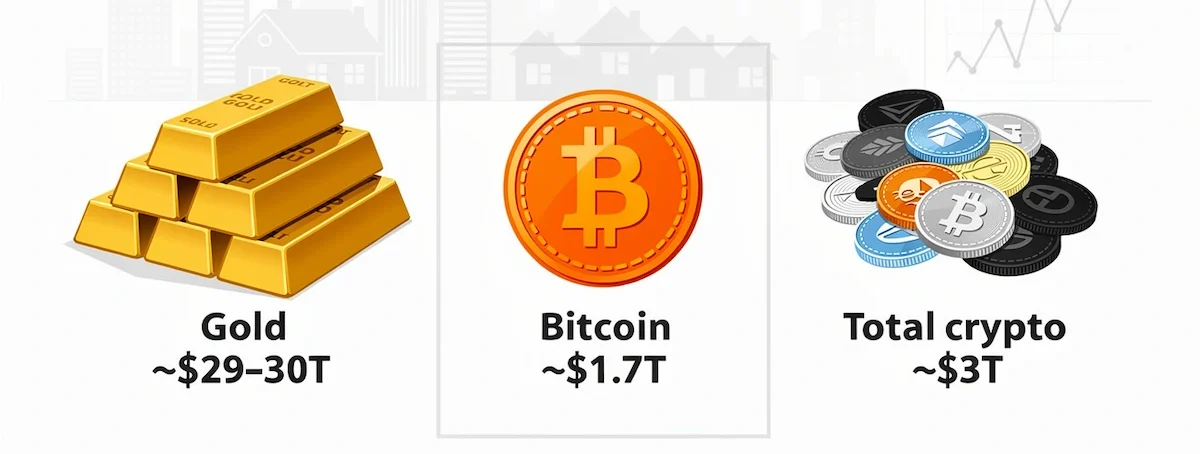
Depending on the price source and the estimate of reserves, that gives roughly $29 trillion to $30 trillion. Read more about both assets in the guide on Bitcoin vs gold.
| Asset | Market cap on 6 October 2026 |
|---|---|
| Gold | about $29 to $30 trillion |
| Total crypto market | about $2.99 trillion |
| Bitcoin | about $1.72 trillion |
On these numbers Bitcoin is about 6% of gold, and gold is about 17 times larger. The Bitcoin market cap vs gold gap would close if each BTC were worth about $1.5 million, using the current circulating supply. That figure shows the scale of the gap and is not a forecast. Supply also differs between the two. New gold is mined every year and no rule fixes its total, while the supply of Bitcoin is capped at 21 million.
Large-Cap, Mid-Cap and Small-Cap: Where Bitcoin Sits
Crypto assets are often grouped by market cap. Large-cap coins have more than $10 billion, mid-cap coins have between $1 billion and $10 billion, and small-cap coins have less than $1 billion. Bitcoin sits far above the first line, at about 170 times the large-cap threshold. Larger assets usually have more exchanges, deeper order books and more attention from institutions, which is why they tend to move less than small tokens. The tier describes size, and it does not remove price swings or risk.
Bitcoin Market Cap vs Ethereum and Other Cryptocurrencies
Ethereum is the second largest crypto asset, and the comparison with Bitcoin shows why the price of one coin says so little about size. The Bitcoin figures below are from 6 October 2026 and the Ethereum figures are from CoinMarketCap on 7 October 2026.
| Metric | Bitcoin | Ethereum |
|---|---|---|
| Price per coin | $85,478 | $2,610 |
| Circulating supply | 20.09 million BTC | 122.11 million ETH |
| Market cap | about $1.72 trillion | about $318.66 billion |
| Max supply | 21 million BTC | no fixed limit |
The Bitcoin market cap is about 5.4 times larger than the market cap of Ethereum. Ethereum has roughly six times more coins in circulation, and its price is about 33 times lower, so the product of the two numbers ends up far below Bitcoin. A full comparison of the two networks, their supply rules and their use cases is in the guide on Bitcoin vs Ethereum.
The same logic explains the idea of unit bias. Many buyers see a token priced at $0.001 and assume it is cheap or has more room to grow than a coin priced at $85,478. The price alone does not show that. A token at $0.001 with 500 billion coins in circulation already has a market cap of $500 million. To match the Bitcoin market cap of $1.72 trillion, that same token would need a price of about $3.44, which means a gain of more than 3,000 times. Check the supply first, and only then judge whether a coin is cheap or expensive.
Why Bitcoin Market Cap Matters and How to Use It
Market cap is the standard way to describe how big an asset is, and Bitcoin market cap is the reference point for the whole crypto market. It is useful in five practical ways:
- Ranking. Every data site orders coins by market cap, so the number decides who is first, second and tenth.
- Comparing size. It puts Bitcoin next to gold, large companies and other coins on one scale, in the same currency.
- Reading headlines. When a title says that Bitcoin reached a market cap of $2 trillion, the reverse Bitcoin market cap formula turns that into a price of about $99,500 per BTC.
- Judging risk. Larger assets have more liquidity and more traders, and they usually move less in one day than small tokens.
- Following trends. A rising market cap together with growing bitcoin dominance shows that money is moving into Bitcoin and not only into altcoins.
The number works best as a starting point. After you check the current Bitcoin market cap, look at the trading volume, the FDV and the share of coins that actually trade, because a single figure cannot describe an asset.
What Bitcoin Market Cap Does Not Tell You
Bitcoin market cap is a useful measure of size and a poor measure of anything else. Four limits matter most.
It Is Not Money Invested
The market cap is the last traded price applied to all coins. A buyer who spends $1,000 can move the price, and every other coin is re-marked at the new price without anyone paying for it. In the same way, a fall in price removes value on paper without any money leaving a vault. The $1.72 trillion of today is therefore not the amount that investors have put into Bitcoin.
Liquidity and Trading Volume
Market cap is not the amount you would get by selling. The 24 hour trading volume on 6 October 2026 was $28.83 billion, which is about 1.7% of the market cap. If a large holder tried to sell a big share of the supply, the price would fall long before the full value was reached. Strategy held 847,999 BTC, or about 4% of the supply, according to CoinGecko, which shows how much of the market cap sits in a few hands. Liquidity, order book depth and trading volume describe how easily coins change owners, and market cap does not.
Lost Coins Still Count
Bitcoin that can never be moved is still part of the circulating supply. Coins are lost when the private key is lost, when a hard drive is thrown away or when the owner dies without a backup. Some estimates put lost coins near 20% of all bitcoin. The wallets linked to Satoshi Nakamoto hold an estimated 1.1 million BTC that have not moved since the early years. Standard market cap counts all of these coins, so the amount of bitcoin that can actually trade is smaller than 20.09 million. Analysts call the part that is really available for trading the free float, and for Bitcoin it is smaller than the circulating supply, because lost coins and coins that long-term holders never sell are not on the market.
Realized Cap and MVRV as a Second View
Analysts add other measures to the headline number. Realized cap values each coin at the price when it last moved on the blockchain, so it follows the cost basis of holders better than the current price does. The MVRV ratio divides market value by realized value and shows how far the current price is from that average cost. These measures need on-chain data and are not part of the standard market cap, but they answer questions that the headline figure cannot.
Common Mistakes When Reading Bitcoin Market Cap
Most errors come from using the wrong supply or from reading the number as more than it is.
- Using max supply instead of circulating supply. Multiplying the price by 21 million gives the FDV, which is about 4.5% above the market cap today.
- Comparing numbers from different sites or times. A gap of 0.5% between CoinMarketCap and CoinGecko can come from the timing of the price alone.
- Treating a high market cap as safety. A large market cap means a large asset. The price of Bitcoin is still 32% below the record from one year ago.
- Judging an asset by its price. A coin priced at $1 can have a larger market cap than a coin priced at $1,000 if its supply is large enough.
- Reading market cap as a price target. The reverse formula shows which price a market cap needs, but it does not say that the price will get there.
Conclusion
Bitcoin market cap explained in one line: the price of one BTC multiplied by the circulating supply. On 6 October 2026 that gave a total Bitcoin market cap of about $1.72 trillion, which is 57.5% of the whole crypto market and about 6% of the market cap of gold. The current Bitcoin market cap moves with the price every second, while supply grows by only about 0.002% per day.
Use the number to compare size, to follow dominance and to put milestones such as the first trillion in context. Read it together with trading volume, liquidity and the FDV, and remember that it is a price-based figure and not a record of money invested.
Frequently Asked Questions
What is Bitcoin market cap?
Bitcoin market cap is the total value of all bitcoin in circulation. It is calculated by multiplying the current price of one BTC by the circulating supply, which is about 20.09 million coins. On 6 October 2026 the result was about $1.72 trillion.
How is Bitcoin market cap calculated?
Use the BTC market cap formula: price per BTC × circulating supply. If the price is $85,478 and the supply is 20,094,062 BTC, the market cap is about $1.7176 trillion. Both inputs are available on CoinMarketCap and CoinGecko.
What is the Bitcoin market cap today?
On 6 October 2026 it was about $1.72 trillion at a price of $85,478. The number changes every second, so check CoinMarketCap or CoinGecko for the live value.
Is Bitcoin market cap the same as money invested?
No. The market cap applies the latest price to every coin, including coins that have not moved for years, so it shows the size of Bitcoin on paper. Money invested is closer to the realized cap, which values each coin at the price when it last moved.
Why do websites show different Bitcoin market cap numbers?
Sites use different price sources, update at different intervals and sometimes count supply in different ways. On 6 October 2026 CoinMarketCap and CoinGecko differed by about 0.5%, and most of that gap came from the price at the time of the reading.
What is the difference between market cap and FDV for Bitcoin?
Market cap uses the circulating supply of 20.09 million BTC, and FDV uses the maximum supply of 21 million BTC. On 6 October 2026 that was about $1.72 trillion against about $1.79 trillion. The gap is small because 95.7% of all coins are already mined.
How big is Bitcoin market cap compared to gold?
Gold has a market cap of roughly $29 trillion to $30 trillion, depending on the price source and the estimate of reserves. That makes Bitcoin about 6% of gold, and gold about 17 times larger. A Bitcoin market cap equal to gold would need a price near $1.5 million per BTC.
What is the all-time high market cap of Bitcoin?
The all-time high Bitcoin market cap is about $2.5 trillion. It was reached on 6 October 2025, when the price hit $126,198 and the circulating supply was about 19.9 million BTC. The current market cap of $1.72 trillion is about $800 billion below that peak.
Can a coin with a low price have a high market cap?
Yes. Market cap is the price multiplied by supply, so a coin priced at $1 with 100 billion coins in circulation has a market cap of $100 billion, which is larger than a coin priced at $1,000 with 10 million coins. The price of one coin says nothing about size until you check the supply.
How much bigger is Bitcoin market cap than Ethereum?
On 6 and 7 October 2026 the Bitcoin market cap of about $1.72 trillion was roughly 5.4 times larger than the Ethereum market cap of about $318.66 billion. Ethereum has more coins in circulation, but its price per coin is about 33 times lower.
Does a higher Bitcoin market cap mean a higher price?
A higher market cap does not cause a higher price. The market cap is the price multiplied by supply, so it rises when the price rises. It shows where the price is now and does not predict where it goes next. A fall of 1% in price removes about $17.2 billion of market cap.