Bitcoin’s price can surge 15% overnight while altcoins barely move. Or Bitcoin can stay flat for weeks while smaller cryptocurrencies double. These patterns are not random. They follow a metric called Bitcoin dominance, which measures how much of the total cryptocurrency market belongs to Bitcoin at any given moment.
When Bitcoin dominance rises, capital is moving toward Bitcoin and away from altcoins. When it falls, money is rotating into alternative cryptocurrencies. Understanding what drives those shifts, and how to read the chart, gives you a clearer picture of where the crypto market stands in its cycle.
What is Bitcoin dominance?
Bitcoin dominance is the percentage of the total cryptocurrency market capitalization represented by Bitcoin. It is Bitcoin’s market share, calculated continuously, visible to anyone, and updated in real time as prices change across thousands of assets.

Since Bitcoin launched in 2009 as the only cryptocurrency, its dominance was 100%. As more coins and tokens entered the market, that figure declined. Today, Bitcoin typically holds between 50% and 65% of the total crypto market cap, meaning it still accounts for more than half the value of everything in the market combined.
The metric matters because it captures something price charts cannot show on their own: how capital is distributed between Bitcoin and everything else. Two scenarios where Bitcoin trades at $90,000 can look identical on a price chart but tell completely different stories on the dominance chart: one where Bitcoin is gaining market share and one where it is losing it.
How Bitcoin dominance is calculated

The formula is straightforward:
Bitcoin Dominance = (Bitcoin Market Cap ÷ Total Cryptocurrency Market Cap) × 100
Bitcoin’s market cap is its current price multiplied by its circulating supply. The total cryptocurrency market cap is the sum of the market caps of every tracked cryptocurrency: coins, tokens, and stablecoins combined.
A concrete example: if Bitcoin’s market cap is $1.8 trillion and the total crypto market cap is $3 trillion, Bitcoin dominance is 60%. That single number tells you Bitcoin controls three-fifths of all value in the crypto market at that moment.
Minor discrepancies appear between platforms like CoinMarketCap, CoinGecko, and TradingView because each tracks a different number of assets. CoinMarketCap includes stablecoins and a broader set of tokens. CoinGecko uses its own methodology. The absolute percentages will differ slightly, but the trend lines are consistent across all platforms.
For background on how market cap works as a metric and why it is more useful than price per coin, see our guide on what is market cap in crypto.
A short history of Bitcoin dominance
Bitcoin dominance has gone through distinct phases that closely mirror the broader history of the crypto market. Understanding those phases makes current readings easier to interpret.
2009-2013: 100% dominance and the first altcoins
When Bitcoin launched in January 2009, it was the only cryptocurrency in existence. Dominance was 100% by definition. The first meaningful challenge came in April 2011 with Namecoin, followed shortly by Litecoin in October 2011. These early altcoins took small slices of the market but Bitcoin’s dominance remained above 90% for most of this period. The crypto market was tiny and Bitcoin was the only name most people knew.
2017-2018: the ICO boom drops dominance to historic lows
The ICO boom of 2017 was the first major structural shift in Bitcoin dominance. Hundreds of new projects launched tokens and raised billions of dollars from retail investors. Capital flooded into alternative cryptocurrencies at a pace Bitcoin could not match. By January 2018, Bitcoin dominance had fallen to approximately 37%, its lowest level up to that point. The crash that followed in 2018 wiped out most of those projects, and Bitcoin’s dominance recovered as capital retreated to what investors considered more reliable ground.
2020-2021: DeFi, NFTs, and the second altcoin season
The DeFi boom of mid-2020 and the NFT wave of 2021 repeated the pattern from 2017 but on a larger scale. Bitcoin’s dominance fell from around 70% in early 2021 to roughly 40% by May 2021 as Ethereum, Solana, Cardano, and dozens of other networks attracted significant capital. This period is referred to as the 2021 altcoin season. In July 2021, as the market corrected, dominance climbed back to 58% while altcoins fell 60-80% from their peaks.
2022-2026: recovery and current levels
The collapse of FTX in November 2022 triggered a sharp contraction in altcoin valuations while Bitcoin held up relatively better. Dominance climbed through 2023 and remained in the 50-60% range through 2024 and into 2025, buoyed by the approval of spot Bitcoin ETFs in January 2024 and growing institutional allocation directly to BTC. As of early 2026, Bitcoin dominance is hovering around 55-60%, with the stablecoin market cap acting as a structural floor that limits how high dominance readings can go without stablecoin exclusion.
For the full timeline of Bitcoin’s price and market development, see our Bitcoin history guide.
How to read the Bitcoin dominance chart
The Bitcoin dominance chart displays one line: the percentage of total crypto market cap held by Bitcoin over time. It does not show price. It shows market share. That distinction is what makes it useful as a separate analytical tool.

What the X-axis and Y-axis show
The X-axis is time. The range you select, whether days, weeks, months, or years, significantly affects what the chart communicates. Daily or weekly views reveal short-term sentiment shifts and reactions to specific events. Monthly and yearly views show structural trends and market cycle positioning.
The Y-axis is the Bitcoin dominance percentage. A small change in percentage can represent a large shift in actual capital. Moving from 55% to 50% in a market worth $3 trillion means roughly $150 billion has rotated out of Bitcoin and into other assets. The steepness and duration of a trend matter as much as the level itself.
On TradingView, Bitcoin dominance trades under the ticker BTC.D. You can apply technical indicators, draw support and resistance levels, and overlay it with Bitcoin’s price chart for combined analysis.
Interpreting a rising dominance trend
When Bitcoin dominance rises, it means Bitcoin’s market cap is growing faster than the total crypto market. The most common reasons:
- Investors are moving out of altcoins and into Bitcoin, treating it as a relatively safer position within crypto.
- A market-wide downturn is underway and Bitcoin is falling less than altcoins, so its percentage share increases even as its price falls.
- A major Bitcoin-specific catalyst, such as an ETF approval, a halving, or a large institutional purchase, is drawing fresh capital directly into BTC without proportional inflows elsewhere.
Rising dominance does not always mean Bitcoin is going up. It means Bitcoin is performing better than the rest of the market on a relative basis. During the FTX collapse in late 2022, Bitcoin fell sharply in price but dominance rose because altcoins fell even harder.
Interpreting a falling dominance trend
Falling Bitcoin dominance means alternative cryptocurrencies are capturing a larger share of total market value. The typical causes:
- Capital is rotating from Bitcoin into altcoins, often after a Bitcoin-led rally has established confidence in the market.
- New technology waves, like DeFi in 2020 or NFTs in 2021, are attracting significant fresh investment directly into altcoin projects.
- Stablecoin market caps are growing, which mechanically dilutes Bitcoin’s percentage share even when Bitcoin itself is not losing ground in nominal terms.
Falling dominance during a rising total market cap is the clearest altcoin season signal. Falling dominance during a falling total market cap usually means altcoins are collapsing faster than Bitcoin.
Bitcoin dominance percentage ranges: what each level means
Different dominance levels have historically corresponded to different market conditions. These ranges are not rules; they are patterns from the historical record.
| Dominance level | What it typically signals | Historical context |
|---|---|---|
| 70% and above | Bitcoin dominant, altcoins struggling, defensive market | Reached ~70% during the COVID crash of March 2020 |
| 50-65% | Standard market conditions, Bitcoin leads but altcoins have room | Most of 2023-2026 has traded in this range |
| 40-50% | Altcoin season building, capital rotating from BTC | Mid-2021 before the May correction; early 2018 peak ICO period |
| Below 40% | Peak altcoin mania, historically unsustainable | January 2018 at ~37%, followed by the year-long bear market |
These thresholds are not precise triggers. A drop from 52% to 48% does not automatically start altcoin season. What matters is the direction and duration of the trend, not crossing any single number. The 37% reading in January 2018 only became meaningful in hindsight; at the time, it looked like a continuation of the altcoin rally.
The four scenarios: BTC price direction vs. dominance direction
Bitcoin’s price movement and its dominance movement can diverge. Reading both together gives a more precise picture of market conditions than either alone.
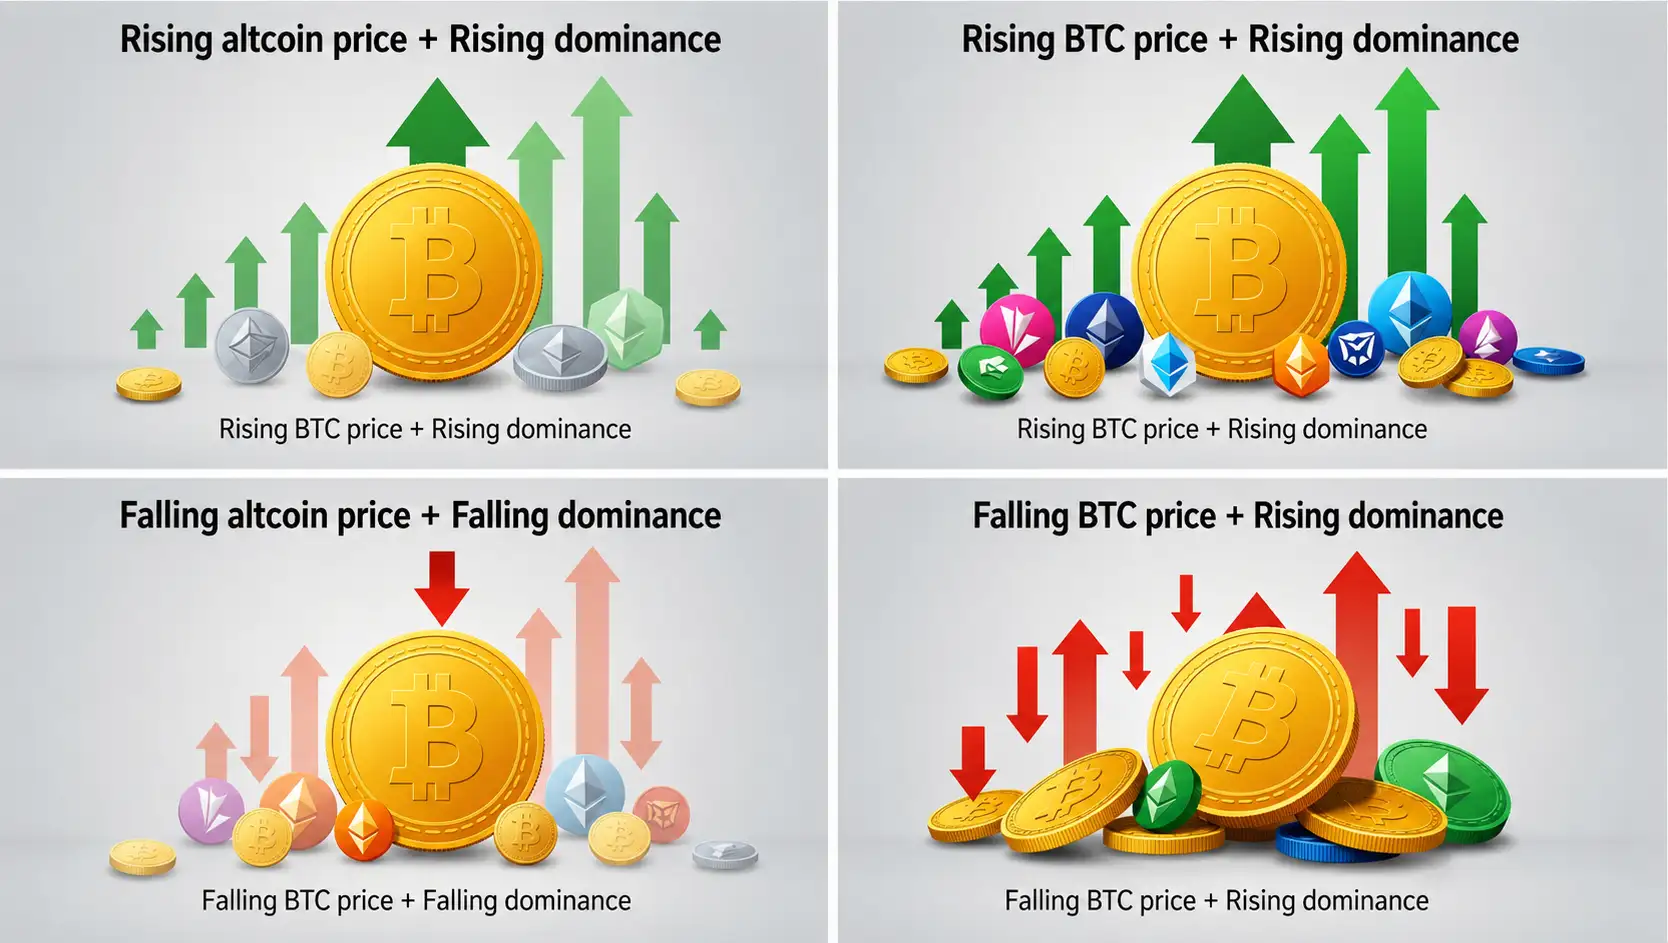
Rising BTC price + rising dominance
Bitcoin is rallying and gaining market share at the same time. Altcoins are either flat or rising more slowly. This typically occurs in the early stages of a bull run when fresh capital enters the market through Bitcoin first. The broader market has not yet entered risk-on mode. Bitcoin is the primary beneficiary of new inflows.
Rising BTC price + falling dominance
Bitcoin is rising but altcoins are rising faster. This is the classic altcoin season configuration. Capital that entered through Bitcoin is now rotating out into higher-risk assets. Historically this pattern appeared in Q4 2017 and Q4 2020, both periods that produced the largest altcoin gains on record.
Falling BTC price + rising dominance
The market is in a downturn but altcoins are falling harder than Bitcoin. Investors are not exiting crypto entirely; they are consolidating into Bitcoin as the lower-risk option within the space. This is common in the early stages of a bear market or during sharp corrections triggered by a specific event. Bitcoin loses less than altcoins and its percentage share of the total market increases as a result.
Falling BTC price + falling dominance
Everything is falling and altcoins are falling faster than Bitcoin. This signals a broad market exit rather than a rotation. Capital is leaving crypto entirely. This configuration appeared in November 2022 during the FTX collapse and in early 2018 as the ICO bubble deflated. For altcoin holders, this is the most damaging scenario.
For context on what altcoins are and how they differ from Bitcoin in terms of market dynamics, see our guide on what is an altcoin.
What influences Bitcoin dominance?
Bitcoin dominance is not controlled by any single factor. It reflects the combined effect of everything happening in the crypto market at any moment.
Bitcoin-specific events
Events that drive capital directly into Bitcoin increase dominance. The four-year halving cycle historically precedes Bitcoin bull runs that pull in fresh capital before it spreads to altcoins. The approval of spot Bitcoin ETFs in the United States in January 2024 created a regulated on-ramp for institutional buyers who wanted Bitcoin exposure specifically, not altcoins. Large corporate treasury purchases, with MicroStrategy being the most prominent example, similarly add to Bitcoin’s market cap without affecting the altcoin market.
Altcoin launches and market cycles
Every major wave of new cryptocurrency projects has diluted Bitcoin’s dominance. The ICO era of 2017, the DeFi summer of 2020, and the NFT and Layer 2 expansion of 2021 all created periods where alternative assets absorbed capital faster than Bitcoin. When those waves reverse, as they inevitably have, dominance recovers as the projects that lacked genuine utility lose most of their value and their market caps shrink or disappear.
Stablecoins and their effect on dominance
Stablecoins are an important caveat to dominance readings. Tether (USDT) and USD Coin (USDC) combined represent hundreds of billions of dollars in market cap. They are included in the total crypto market cap calculation on most platforms, which mechanically reduces Bitcoin’s dominance percentage even when no actual capital has moved between Bitcoin and altcoins. A growing stablecoin market cap simply adds to the denominator of the dominance formula.
Some analysts prefer to look at dominance excluding stablecoins for a cleaner read on the Bitcoin vs. altcoin split. CoinMarketCap does not exclude them by default, which is worth keeping in mind when comparing dominance readings over different time periods. The stablecoin market has grown significantly since 2019 and that growth has had a structural downward effect on measured Bitcoin dominance.
Regulatory and macroeconomic factors
Regulatory news affects dominance in predictable ways. Crackdowns or enforcement actions against specific altcoins or exchanges tend to push capital toward Bitcoin, which has the clearest regulatory status as a commodity in most major jurisdictions. When the broader macroeconomic environment turns risk-off, with rising interest rates, banking stress, or geopolitical events, crypto investors often reduce altcoin exposure and concentrate in Bitcoin. This is why Bitcoin dominance spiked during the March 2020 COVID crash and again in the 2022 rising-rate environment.
For more on how proof-of-work and proof-of-stake networks differ and why that affects Bitcoin’s position in the market, see our guide on proof of work vs proof of stake.
Bitcoin dominance vs. altcoin dominance
Altcoin dominance is the direct inverse of Bitcoin dominance. If Bitcoin dominance is 60%, altcoin dominance is 40%. The two numbers always add up to 100% of the total market.

When Bitcoin dominance falls, altcoin dominance rises by the same amount. The two metrics move in opposite directions by definition. Tracking both on the same chart makes the rotation dynamic visible: you can see exactly how much market share is moving from one side to the other.
Some analysts track Ethereum dominance separately as ETH.D on TradingView. Ethereum has grown large enough that the Bitcoin vs. everything-else framing is increasingly simplified. A more precise view splits the market into Bitcoin, Ethereum, stablecoins, and all other altcoins. When Ethereum dominance falls while Bitcoin dominance holds steady, the rotation is happening within the altcoin category, meaning smaller assets are gaining at Ethereum’s expense rather than Bitcoin’s.
For a breakdown of how Ethereum and other alternative networks compare to Bitcoin in terms of what they are built for, see our guide on what is Bitcoin.
Limitations of Bitcoin dominance as a metric
Bitcoin dominance is a useful lens but not a precise instrument. Several structural issues limit its reliability.
- Stablecoin distortion. As covered above, the large and growing stablecoin market adds to the total crypto market cap and mechanically reduces Bitcoin’s dominance percentage. A rise in stablecoin usage does not represent altcoins gaining on Bitcoin, but it affects the dominance number the same way.
- Ghost market caps. Projects with high prices but very low trading volume can carry large calculated market caps that do not represent real accessible capital. These inflate the total market cap denominator without representing genuine investment.
- Ethereum’s scale changes the picture. The original idea behind Bitcoin dominance was Bitcoin vs. everything. With Ethereum holding 15-20% of total market cap on its own, the simple BTC vs. rest framing misses important dynamics within the non-Bitcoin segment of the market.
- Dominance does not tell you about total market direction. Bitcoin’s dominance can rise while the total market cap is falling. A 60% dominance reading looks different depending on whether the total market is $1 trillion or $3 trillion.
- No single dominance threshold reliably predicts outcomes. The 50% level is often cited as an altseason trigger, but historical examples show dominance trading below 50% for months without a broad altcoin rally, and above 50% during periods of strong altcoin performance in specific sectors.
How to use Bitcoin dominance in your strategy
Dominance works best as one input among several, not as a standalone signal. Here is how most experienced market participants use it.
When dominance is rising: what to consider
A rising dominance trend suggests Bitcoin is outperforming the altcoin market on a relative basis. For portfolio decisions, this may support increasing the proportion of Bitcoin relative to altcoins. Altcoin positions may be underperforming not because the market is falling but because capital within crypto is concentrating in Bitcoin. Reviewing altcoin positions and taking profits on those with weak fundamentals is a reasonable response to a sustained rise in dominance.
This does not mean selling all altcoins. It means understanding that the wind is blowing toward Bitcoin and positioning accordingly until the trend shows signs of reversing.
When dominance is falling: what to consider
Falling dominance, particularly when the total crypto market cap is also rising, is the most favorable environment for altcoins. This is when historically the largest altcoin gains have occurred. A portfolio shift toward altcoins with genuine utility, strong development activity, and rising trading volume is how most traders respond to this environment.
The key question to ask when dominance is falling is whether the total market cap is growing or contracting. Falling dominance plus rising total market cap is a genuine altseason signal. Falling dominance plus falling total market cap is a broad market exit where altcoins are simply losing more than Bitcoin.
Combining dominance with other indicators
Dominance paired with additional context gives more reliable readings:
- Fear and Greed Index: Rising dominance during extreme fear confirms a risk-off rotation into Bitcoin. Falling dominance during extreme greed may signal the late stages of an altcoin run.
- Total crypto market cap trend: The most important context for any dominance reading. Direction and level of total market cap determines whether a dominance move is bullish or bearish for altcoins.
- On-chain data: The proportion of Bitcoin supply that has not moved in over a year (long-term holder supply) adds context about whether Bitcoin’s market cap is being held or actively traded.
- Trading volume by asset: Dominance shifts backed by high trading volume are more meaningful than those occurring on thin volume. A dominance move on low volume may reverse quickly.
Weekly trends in dominance are signal. Daily fluctuations are noise. Checking dominance once a week rather than hourly leads to better pattern recognition and fewer reactive decisions based on short-term price swings.
For more on how to evaluate cryptocurrency assets using fundamental metrics, see our guide on what is cryptocurrency.
Where to track Bitcoin dominance

Several platforms publish Bitcoin dominance data in real time. Each has slightly different coverage and methodology.
- CoinMarketCap: dominance chart available at coinmarketcap.com/charts/bitcoin-dominance. Includes stablecoins and a broad set of tokens in the total market cap calculation.
- CoinGecko: global charts section shows Bitcoin dominance using CoinGecko’s own asset coverage, which differs slightly from CoinMarketCap.
- TradingView (BTC.D): the most flexible option for technical analysis. for technical analysis. You can overlay indicators, compare with Bitcoin’s price chart, and view community analysis. Search BTC.D to find the dominance chart.
- CoinStats: provides visualizations and historical data with a clean interface for comparing dominance trends over time.
The absolute percentages will differ slightly between platforms because each includes a different set of assets. Use one platform consistently rather than switching between them, so the baseline you are working from stays constant. For most purposes, CoinMarketCap or TradingView BTC.D are the most widely referenced sources and the ones most likely to appear in analyst commentary you read elsewhere.
Live Bitcoin dominance data is available directly at CoinMarketCap’s dominance chart and via the BTC.D ticker on TradingView.
Frequently asked questions
What is a good Bitcoin dominance percentage?
There is no single level that is “good.” It depends on what you are trying to assess. A dominance of 50-65% is considered a standard market environment where Bitcoin leads but altcoins have room to perform. Above 65% suggests a defensive or Bitcoin-focused market. Below 45% has historically coincided with elevated altcoin activity. The direction and speed of the trend matters more than any specific number.
Does high Bitcoin dominance mean altcoins will fall?
Not necessarily. High dominance means Bitcoin holds a large share of total crypto market cap, but altcoins can still rise in absolute price terms during periods of high dominance if the overall market is growing. What high dominance does suggest is that altcoins are likely underperforming Bitcoin on a relative basis, meaning Bitcoin is gaining more than altcoins in the same time period.
What does it mean when Bitcoin dominance drops below 50%?
Historically, dominance dropping below 50% has often coincided with periods of strong altcoin performance. The 2021 altcoin season saw dominance fall to around 40%. But crossing 50% is not an automatic trigger for anything. The context matters: is total market cap rising or falling when dominance drops? Rising total market cap plus falling dominance is a more reliable altseason signal than falling dominance alone.
Is Bitcoin dominance the same as Bitcoin price?
No. Bitcoin dominance measures market share, not price. Bitcoin’s price and its dominance can move in opposite directions. In 2021, Bitcoin’s price reached $64,000 in April while dominance was falling, because altcoins were rising faster. Later that year, Bitcoin hit a new high of $68,000 in November while dominance had partially recovered. Price and dominance are related but separate metrics.
Can Bitcoin dominance ever reach 100% again?
Practically speaking, no. The stablecoin market alone represents hundreds of billions of dollars in total crypto market cap. Even if every altcoin project disappeared overnight, stablecoins would remain and Bitcoin’s dominance would top out well below 100%. More realistically, the expansion of the crypto market across thousands of projects makes a return to the near-100% levels of 2009-2011 structurally impossible.
What is the difference between Bitcoin dominance and altcoin season?
Bitcoin dominance is the metric. Altcoin season is a market condition identified partly by watching that metric. Altcoin season generally refers to a period when altcoins broadly outperform Bitcoin, which is reflected on the chart as a declining Bitcoin dominance trend. One common informal definition is that altcoin season has started when 75% of the top 50 cryptocurrencies have outperformed Bitcoin over the previous 90 days.
How often does Bitcoin dominance change?
Continuously. Every price movement across every tracked cryptocurrency updates the total market cap calculation and with it the Bitcoin dominance figure. The number technically changes every second. For practical purposes, daily closes are meaningful for short-term analysis, weekly trends for medium-term positioning, and monthly charts for understanding where you are in the broader market cycle.
What is BTC.D on TradingView?
BTC.D is the ticker symbol for the Bitcoin dominance index on TradingView. It represents the same calculation as the Bitcoin dominance percentage, expressed as a tradable chart you can analyze with technical tools. Some exchanges also offer derivatives that let traders take positions on whether Bitcoin dominance will rise or fall, independent of Bitcoin’s price direction. For most investors, BTC.D on TradingView is simply the cleanest way to visualize Bitcoin dominance trends alongside other charts.